Every spring and summer, millions of people with pollen allergies face the same dilemma: do you risk going outside for a walk, a run, or a weekend picnic-or stay indoors and miss out? The answer doesn’t have to be a guess. With pollen forecasting, you can plan your outdoor time around the worst days-cutting symptoms by up to 65% and reducing how often you need antihistamines.
How Pollen Forecasting Actually Works
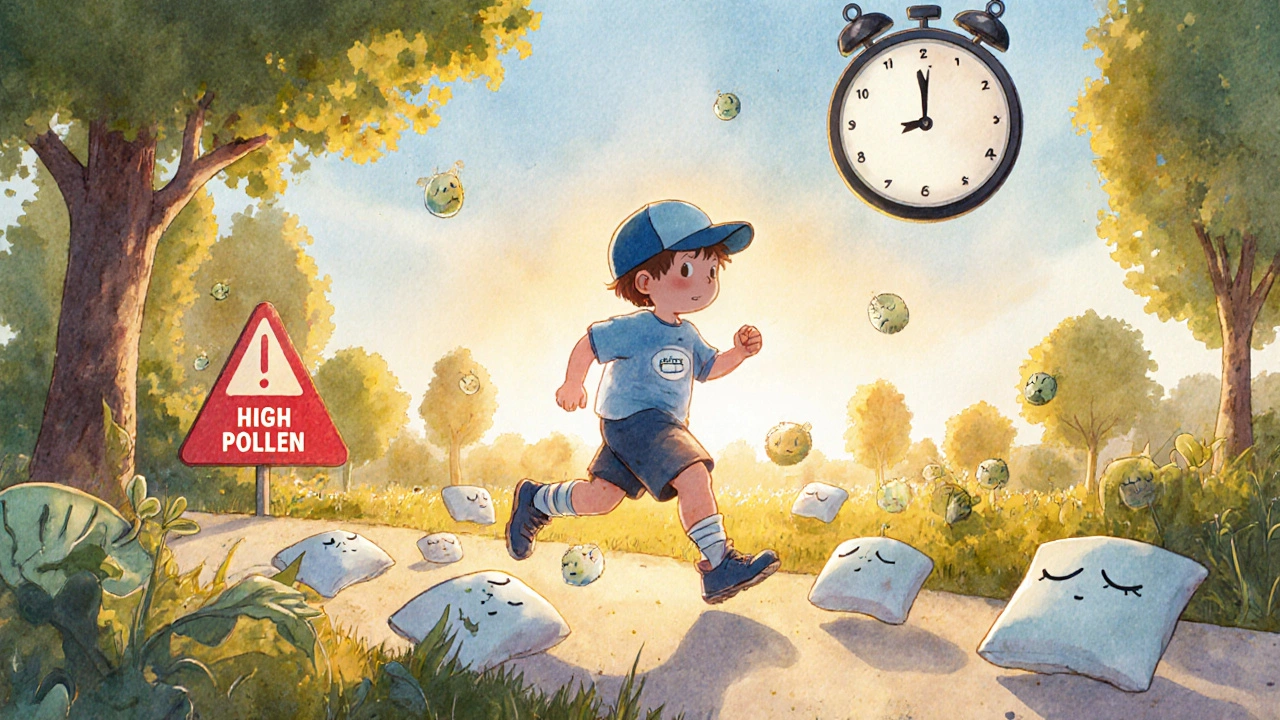
Pollen forecasting isn’t magic. It’s science built on decades of data. Experts track how weather, plants, and wind interact to predict how much pollen will be in the air each day. The core idea is simple: pollen counts rise when it’s warm, dry, and windy, and drop after rain. But the details matter.For example, tree pollen peaks between 5 and 10 a.m. after the morning dew evaporates. Grass pollen hits its highest levels midday, from 10 a.m. to 4 p.m. Weeds like ragweed? They release the most pollen in the late afternoon, from 4 to 8 p.m. If you know your trigger, you can time your activities to avoid the worst hours.
Modern systems like BreezoMeter and the Copernicus Atmosphere Monitoring Service (CAMS) use satellite data, ground sensors, weather models, and even traffic patterns to predict pollen levels with 82-89% accuracy. These tools don’t just give you a number-they show you whether pollen is low (under 50 grains per cubic meter), moderate (51-149), high (150-499), or very high (500+). For ragweed, even 20 grains per cubic meter counts as high.
Why Your Local Weather App Isn’t Enough
Most weather apps show rain, temperature, and wind-but they rarely tell you what’s in the air. That’s a problem. A sunny day with 25°C and a light breeze might look perfect for a hike. But if it’s peak grass pollen season and the wind is blowing from a nearby field, your sneezing fit could start before you even leave the driveway.Traditional pollen monitors, like the rotorod devices used by the National Allergy Bureau, measure actual pollen in the air-but only at fixed stations. They’re accurate for their location but can’t predict what’s coming next door. That’s why hyperlocal forecasts matter. A park 2 kilometers away might have low pollen because of a tree barrier or recent rain, while your street is swarming with it.
Apps like BreezoMeter and WeatherBug now offer 1.5-kilometer resolution forecasts, meaning you get data specific to your neighborhood. Free services like Pollen.com are helpful but only give you 10-kilometer accuracy. That’s like knowing the weather for your city, not your street.
What the Numbers Mean for Your Plans
Knowing the forecast is one thing. Using it wisely is another. Here’s how to translate pollen levels into real-life decisions:- Low (≤50 grains/m³): Safe for extended outdoor time. Ideal for morning runs, gardening, or playing with kids.
- Moderate (51-149): Limit prolonged exposure. Wear sunglasses and a mask if you’re outside for more than an hour.
- High (150-499): Avoid outdoor exercise. If you must go out, do it early morning or right after rain. Keep windows closed.
- Very High (≥500): Stay indoors if possible. Even short walks can trigger severe symptoms. Reschedule outdoor plans.
And don’t forget seasonal patterns. In temperate regions like Perth, tree pollen starts in late winter (August-September), grass peaks in spring (October-November), and weeds take over in late summer (February-March). Knowing your local cycle helps you prepare months ahead.
How to Use Forecasts Like a Pro
Using pollen forecasts isn’t just about checking an app. It’s about building a routine. Here’s what works for people who’ve mastered it:- Check two sources. Don’t rely on just one. Compare BreezoMeter, Pollen.com, and your local health department’s report. Discrepancies happen.
- Time your activities. Run or bike before 7 a.m. or after 7 p.m. when counts are lowest. Avoid midday outdoor workouts during grass season.
- Use rain as your ally. Rain washes pollen out of the air. Wait 2-4 hours after a shower to go outside. But avoid going out right after a storm-wind can kick up pollen from wet ground.
- Track your symptoms. Use a journal or app to note when you feel worse. Over time, you’ll spot patterns-like how your nose reacts to oak pollen but not birch.
- Combine with medication. Take antihistamines the night before a high-pollen day. They work better when taken preventatively.
One runner in Melbourne told me she cut her allergy meds in half after switching her runs from 6 p.m. to 6 a.m. Another parent in Perth stopped her son’s afternoon soccer games during ragweed season and moved them to early mornings. Both saw fewer emergency visits and better sleep.
When Forecasts Fail-And What to Do
Pollen forecasts are powerful, but they’re not perfect. Thunderstorms can cause sudden spikes. In Melbourne’s 2016 epidemic, pollen counts tripled in under 30 minutes after a storm, triggering asthma attacks in people who’d never had them before. No forecast saw it coming.Also, forecasts often miss localized disturbances. Mowing the lawn, raking leaves, or even walking through a dusty park can stir up pollen that wasn’t airborne before. That’s why one user on Reddit said: “The app said low grass pollen, but I had to use three antihistamines after mowing.”
Here’s how to handle surprises:
- Keep a rescue inhaler or antihistamine handy if you’re going outside.
- Change clothes and shower after being outdoors-pollen sticks to skin and hair.
- Use air purifiers indoors, especially in bedrooms.
- If symptoms flare unexpectedly, assume it’s pollen-even if the forecast says otherwise.
The Bigger Picture: Why This Matters
Pollen seasons are getting longer and stronger. Since 1990, the U.S. pollen season has extended by over 20 days, and concentrations have risen by 21%. Climate change is making this worse. Warmer winters mean plants start releasing pollen earlier. Drier summers mean more wind, more dispersal, more exposure.That’s why organizations like the World Allergy Organization and the European Academy of Allergy and Clinical Immunology now call pollen forecasting an “essential part of allergy management.” Schools in the U.S. are adjusting recess schedules. Professional sports teams are tracking pollen to protect athletes. Even the UN recognizes it as a public health tool tied to Sustainable Development Goal 3-Good Health and Well-being.
For you, it’s simpler: you don’t have to suffer through spring and summer. You can take back your outdoor life. It’s not about avoiding nature. It’s about enjoying it without paying the price in sneezes, itchy eyes, and fatigue.
What’s Next for Pollen Forecasting
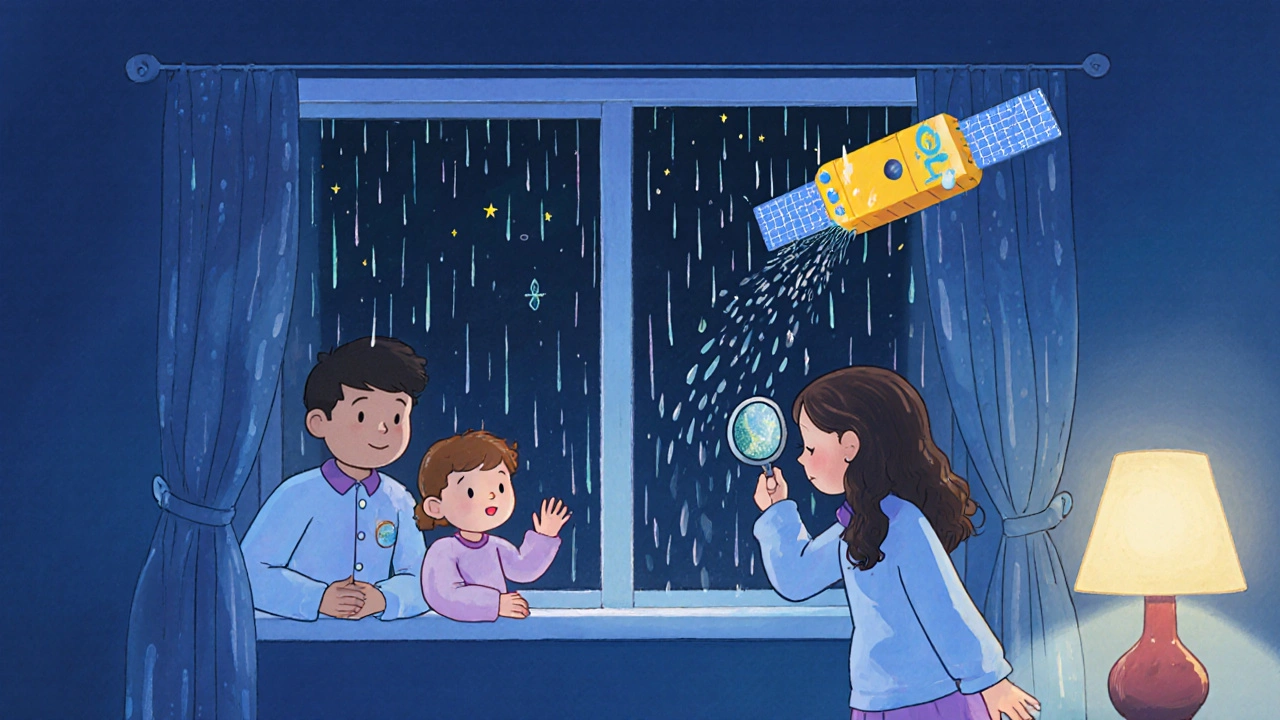
The next big leap is coming in 2025. The European Space Agency is launching PollenSat-a satellite designed to detect pollen types from space with 5-kilometer resolution. That means global coverage for the first time. Right now, 47% of countries have no certified pollen monitors. PollenSat could change that.Meanwhile, Apple Health and BreezoMeter are partnering to link your pollen exposure with your heart rate, sleep, and symptom logs. Imagine your phone telling you: “Your pollen exposure today was 30% higher than your personal threshold. That’s why you woke up congested.”
These aren’t sci-fi ideas. They’re happening now. And they’re making a real difference.
What time of day has the lowest pollen count?
Pollen counts are usually lowest in the early morning (5-7 a.m.) and late evening (7-9 p.m.). Tree pollen drops after sunrise, grass pollen declines after 4 p.m., and weed pollen falls after dark. For most people, the safest window for outdoor activity is between 5 and 7 a.m., especially after a rain.
Can pollen forecasts predict thunderstorm asthma?
No, current forecasts cannot reliably predict thunderstorm asthma. These rare but dangerous events happen when rain breaks apart pollen grains into tiny particles that get sucked into the lungs. Melbourne’s 2016 outbreak showed how fast this can happen-pollen counts spiked 300% in under 30 minutes. Research is underway to build AI models that detect atmospheric instability and predict these events, but they’re not ready yet.
Should I trust free pollen apps or pay for premium ones?
Free apps like Pollen.com are good for general planning-they’re 75% accurate and cover major pollen types. But if you live in a city with complex microclimates or want hyperlocal accuracy (like knowing if your park is safe), pay for BreezoMeter or WeatherBug. They offer 1.5km resolution and are 82% accurate. For most people, free apps are enough. If you’re an athlete, parent, or have severe allergies, the upgrade is worth it.
Which pollen type affects me the most in Perth?
In Perth, the main allergens are ryegrass (October-December), olive trees (November-January), and ragweed (February-March). Ryegrass is the biggest problem-it’s everywhere and produces massive amounts of pollen. If you’re allergic, focus on the grass season. Check local forecasts from the WA Department of Health for the most accurate regional data.
Do I still need allergy medication if I use pollen forecasts?
Yes-but you’ll need less. Forecasts help you avoid exposure, but they don’t eliminate it. Taking a non-drowsy antihistamine the night before a high-pollen day can prevent symptoms from flaring. Many users report cutting their medication use by 40-60% when they combine forecasts with smart timing. Don’t stop meds cold turkey. Use forecasts to reduce reliance, not replace them.
How do I know if my forecast is accurate for my area?
Test it. On a high-pollen day, go outside for 15 minutes without medication. If you feel symptoms, the forecast was likely right. If you feel fine, it might be off. After 2-3 weeks of comparing your symptoms to the forecast, you’ll learn which apps are most accurate for your street or suburb. Local knowledge beats generic data.

9 Comments
Lemmy Coco
man i just checked breezometer this morning and it said low pollen but i sneezed so hard i knocked my coffee over. turns out my backyard is basically a ragweed factory. guess i need to start checking my exact street, not just the city.
rob lafata
lol so you’re telling me i’ve been an idiot for 12 years by running at 6pm? i thought i was being healthy. turns out i was just feeding my allergies like a damn buffet. 82% accuracy? more like 82% of people are too lazy to read the damn app. get your life together.
Rusty Thomas
OMG I JUST REALIZED I’VE BEEN DOING EVERYTHING WRONG 😭 I used to think rain = good for allergies but now I know it’s a trap?!? I went for a walk after a storm last week and cried for an hour because my eyes were on fire. I need to start journaling. anyone wanna be my symptom accountability buddy?? 🙏
swatantra kumar
bro in india we don’t even have apps for this. we just know pollen season starts when the neem trees bloom and your nose starts acting like a broken faucet. 😅 but hey, if you’re paying for 1.5km accuracy… you’re richer than my entire village. 🌿💸
Cinkoon Marketing
i mean… it’s nice that we have all this tech now, but honestly? i just check the weather and if it’s windy, i stay inside. i don’t need to know if it’s 150 or 180 grains per cubic meter. i know my nose hates wind. 🤷♀️
robert cardy solano
used to think i was just bad at mornings until i started running at 5:30am. no sneezing. no itch. just quiet streets and fresh air. the app was right. i was wrong. sometimes the simplest fix is the one you ignore the longest.
Pawan Jamwal
why are we relying on western apps? in india we’ve had natural pollen calendars for centuries - mango bloom = grass season, monsoon = relief. we don’t need satellites. we need to stop copying American tech and start trusting our own knowledge. 🇮🇳
Bill Camp
THEY’RE LAUNCHING A SATELLITE JUST TO TRACK PINE NEEDLES???!?!? this is what capitalism does to nature - turns breathing into a subscription service. i miss the days when you just closed your windows and prayed. now i need a credit card and a PhD to go outside. 😤
Matthew McCraney
you know what’s really happening? the government is hiding the truth. pollen isn’t natural - it’s engineered. they pump it into the air to keep us docile, buying antihistamines and apps. why do you think they only track 47% of countries? the rest are being deliberately ignored. don’t be fooled. the real enemy is in the labs, not the trees.